Getting Started With the techOMS Statistics & Exceptions Dashboard [Information]
Last updated: October 6, 2026
The techOMS Statistics & Exceptions Dashboard gives you a consolidated view of Sales Order statistics and current processing exceptions, helping you identify processing issues that require investigation.
Supported exceptions can originate from Sales Channels or Fulfillment Channels. The Exceptions section surfaces supported processing operations rather than providing a complete history of every processing log entry.
The techOMS Statistics & Exceptions Dashboard is in beta. Sales Order statistics are based on supported beta Sales Channels, while the Exceptions section can also display supported processing exceptions from Sales Channels and Fulfillment Channels. For a complete list of supported Sales Channels, refer to techOMS Sales Channels - Master List [Guides List].
This article is divided into the following sections:
Dashboard Modes
Organization-Level
Account-Level
Dashboard Structure
Filtering Data
I. DASHBOARD MODES
The dashboard has two available modes:
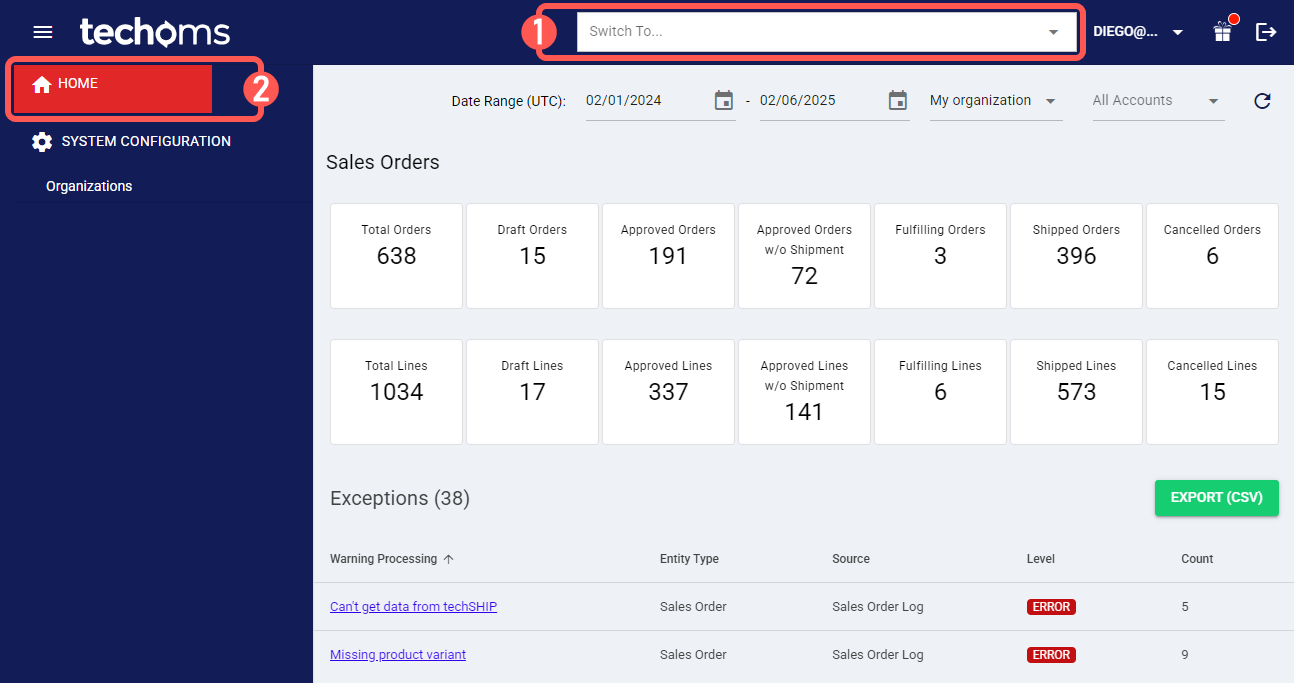
i. Organization-Level

NOTE: To use this mode your user must be an organization-level user, regardless of their role.
1. Ensure that no account is selected in the header dropdown menu.
2. Click Home from the left menu.
This displays the dashboard using the entire selected organization's data (that is, considering all the selected organization's accounts).
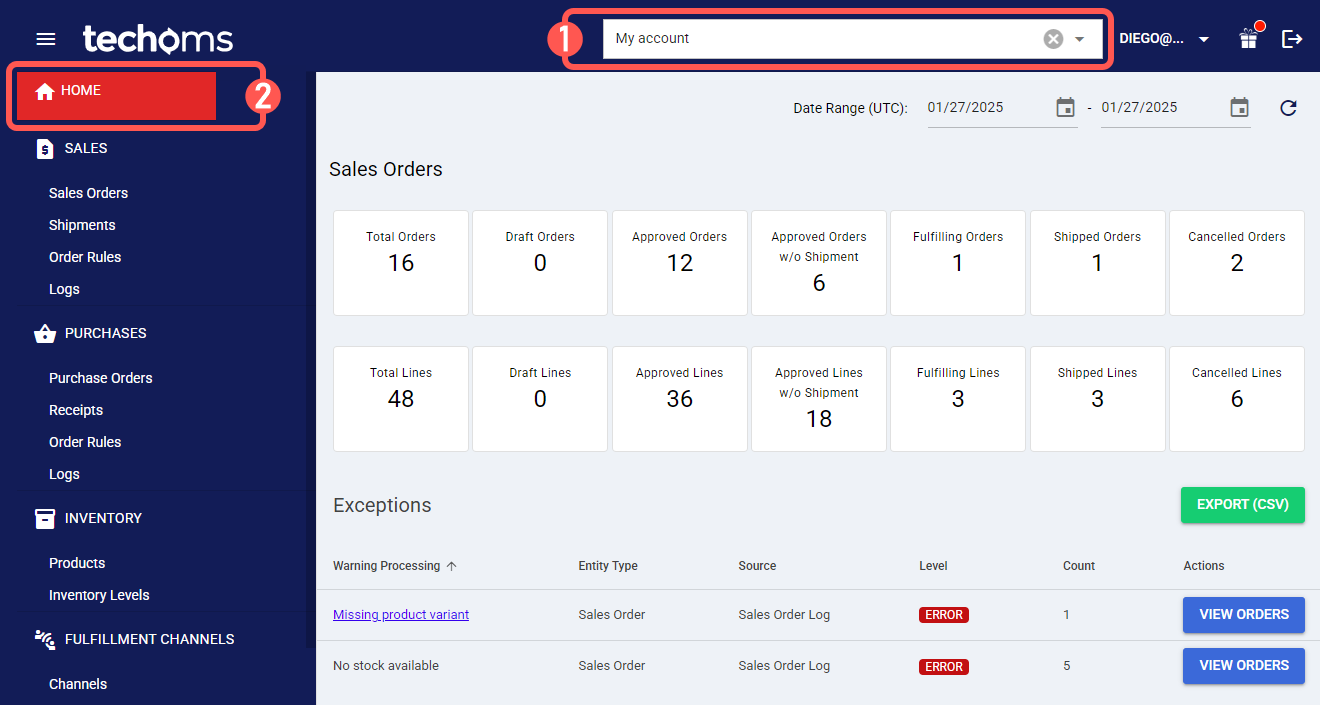
ii. Account-Level
1. Select the desired account from the header dropdown menu.
2. Click Home from the left menu.
This displays the dashboard using the entire account's data.
II. DASHBOARD STRUCTURE
The dashboard has three main sections:
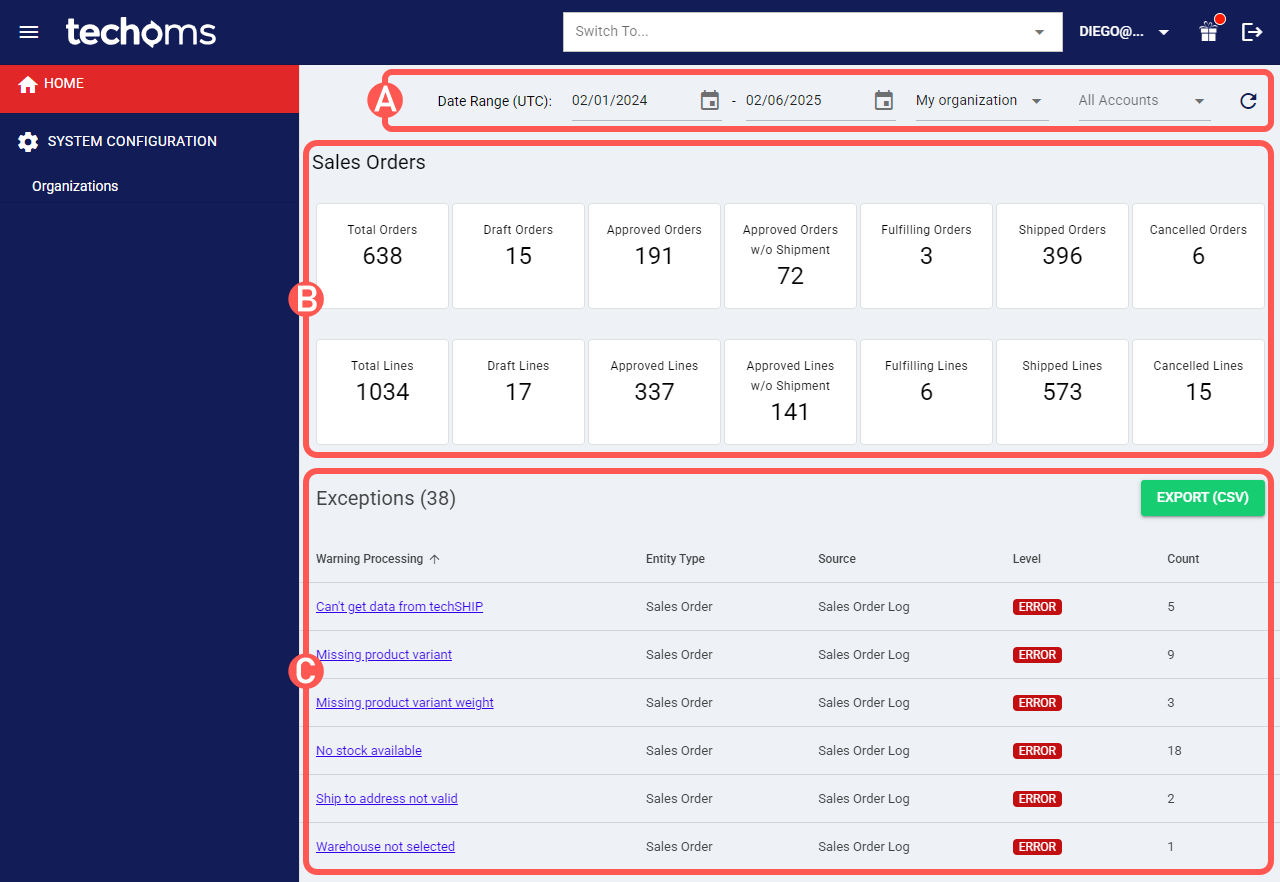
A. Filter controls: Filters the data to be considered by the entire dashboard.
B. Sales Orders: Displays sales order data in tiles, categorized by status. Each tile shows the amount of sales orders (first row) and lines (second row) within them.
NOTE: To learn more about how to view sales orders statistics, refer to How to View Sales Orders Statistics [Step-by-Step guide].
C. Exceptions: Displays a list of supported processing exceptions, with details varying based on the dashboard mode:
Organization-Level: Provides a high-level summary of processing exceptions across your organization, including exceptions represented across your organization's accounts.
Account-Level: Provides processing exception data for more detailed investigation within your account.
You can sort the Exceptions table by clicking a column header. The table reflects currently active supported processing issues when the dashboard is refreshed.
NOTE: To learn more about how to handle exceptions, refer to How to Handle Orders Exceptions [Step-by-Step guide].
III. FILTERING DATA
To filter the dashboard data:
1. Open the dashboard in the desired mode.
2. Set the desired filters:
Date Range: To set a date range based on the displayed time zone.
NOTE: The considered time zone depends on your user level. Organization and System-level users use the organization's time zone, while account-level users use the account's time zone.
Organization: To filter data by organization.
Account: To filter data by a specific account within the selected organization.
NOTE: Organization and Account filters are available only at the organization-level mode.
3. Click the refresh icon to apply the selected filters.
Repeat this step each time the filters are modified.
